

Issue #202 - Superbull on XOP
Superbull on XOP...

Trades are for educational purposes and not a recommendation or financial advise.
Market Scorecard

Market continue to slide amidst uncertainty on the US policies and tariffs. HSI continue to be up but should hit some profit taking action soon.
Trade Scorecard
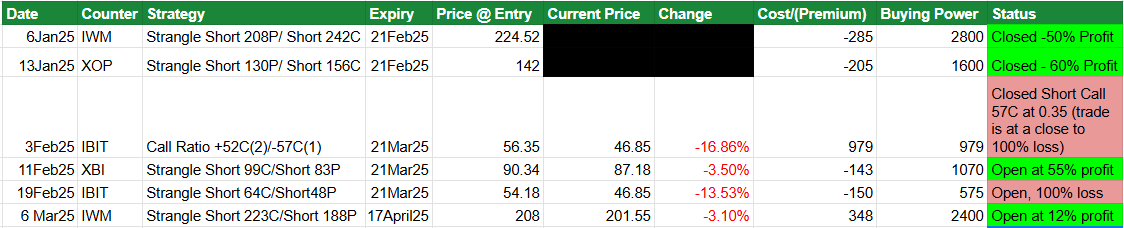
SUPERBULL ON XOP
Today we are diving into an exciting options trade on XOP—a super bull trade structured to take advantage of a potential rebound in oil prices. XOP is the oil exploration and production ETF and invest in names like Devon Energy and Chevron.
📉 Market Context: Why a Bullish Trade?
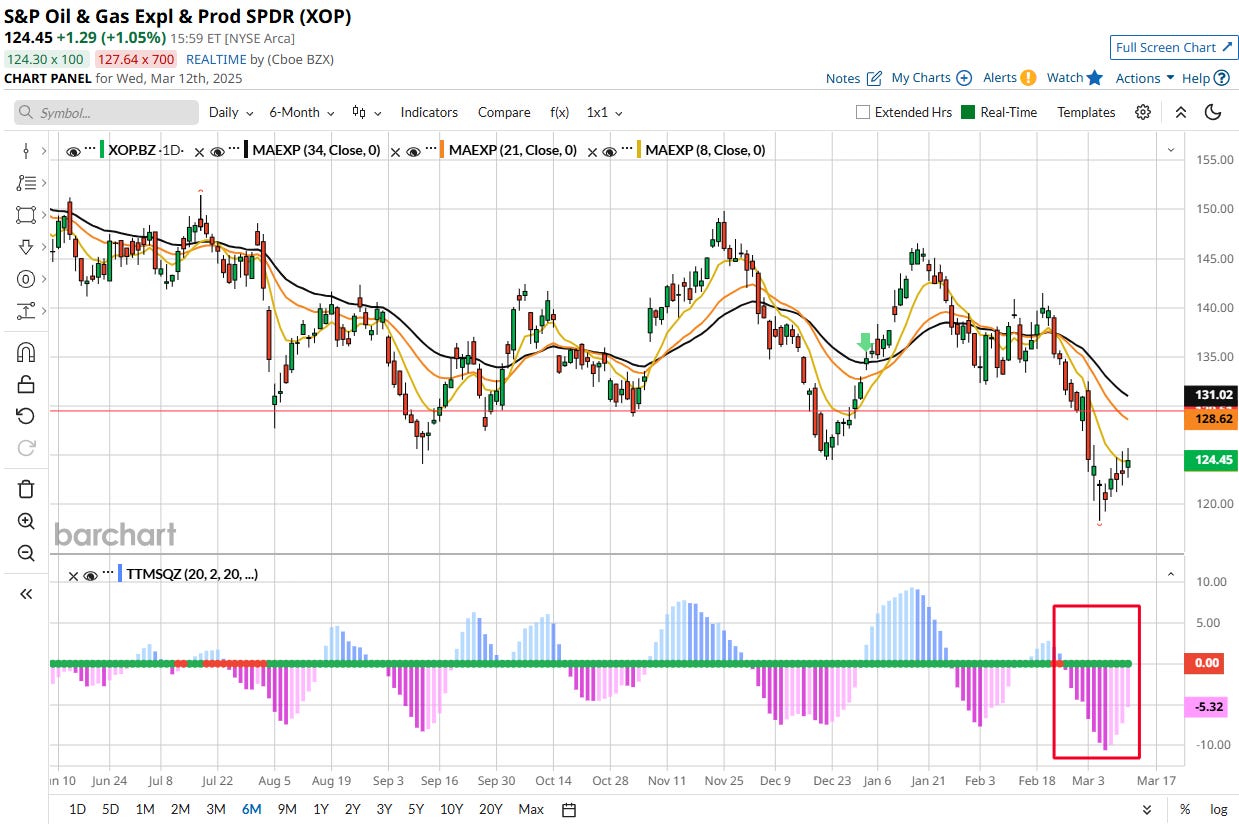
Let’s set the stage. Since January, XOP—an ETF tracking oil and gas exploration and production stocks—has dropped from $146 to $123. At the same time, crude oil prices have fallen from $77.7 to $67 as OPEC and Russia is set to increase production.
Now, here’s our thesis:
XOP has pulled back significantly but could find support and rebound toward 130 in the next month.
Crude oil may stabilize, and if it starts moving higher, XOP should follow.
We want a trade that benefits from this potential bounce while keeping capital risk in check.
🛠️ Trade Structure: The Super Bull Trade
To capture this move, we structured an options trade expiring April 16 (34 days out). It consists of:
✅ Buying the 125 Call
✅ Selling the 130 Call → Forms a Bull Call Spread
✅ Selling the 110 Put → Helps finance the trade
This trade costs a net $0.54 per contract, or $54 total.
📈 Profit & Loss Scenarios
Let’s break down the potential outcomes:
1️⃣ Max Profit: $446
If XOP climbs to 130 or higher, our call spread reaches full value, giving us a max profit of $5.00 per contract (or $500 per spread).
Since we paid $54, our net gain is $446.
2️⃣ Small Loss: -$54
If XOP stays between 110 and 125, the bull call spread expires worthless but the short put also expires worthless.
Our only loss? The $54 premium we paid.
3️⃣ Max Risk: $11,054
If XOP falls below 110, we could get assigned on the short put.
Worst-case scenario: XOP goes to zero, leaving us with a $11,054 max loss (highly unlikely but important to acknowledge).
🧐 Why This Trade?
Leverage: Instead of buying shares, we control 100 shares per contract for just $54.
Defined Risk: We know exactly what we stand to lose.
Financed Call Spread: The short put helps reduce our cost.
Managing the Trade
If XOP moves up quickly, we might take profits early rather than hold till expiration.
If XOP stays flat, we could roll the short put out to a later expiration.
If XOP drops too much, we’ll need to decide whether to close or adjust before assignment risk kicks in.
That’s the play! If you’re trading XOP, let me know your thoughts. Do you see oil rebounding? Would you structure this trade differently?
Trades are for educational purposes and not a recommendation or financial advise.
IBIT Call Ratio (UPDATE ISSUE #198)
Crypto has been decimated these 2 weeks. The announcement of the Crypto Reserve by Trump is more of a selling opportunity. IBIT has hit back to its lows of $43.95 and have since recovered. Today it trades at $46.50.
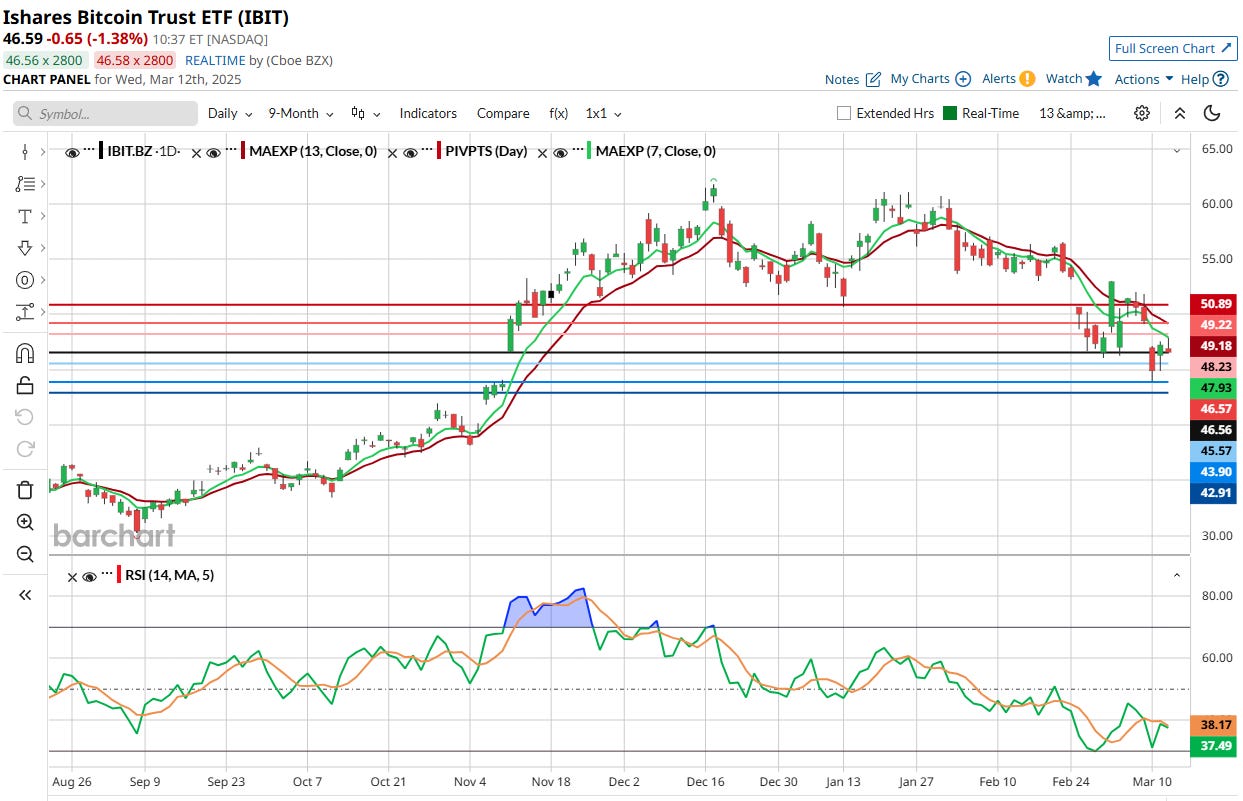
The trade is likely go into a full loss as we had run out of time to recover as expiry is on 21 March 2025, just slightly above a week’s time. We will just take a full loss on this trade and leave it to run in case some big jump in the next days for Bitcoin.
Trades are for educational purposes and not a recommendation or financial advise.
STRANGLE ON XBI (UPDATE ISSUE #199)

XBI continue to slide but seem to find support at $84 level. Today it trades at around $87. The trade is in a loss now but as it found support, the price could bounce back up which is positive for the trade. Further, it would be closer to expiry also and the options decay would have been more by then. The trade is in play and price action is as expected.
Trades are for educational purposes and not a recommendation or financial advise.
STRANGLE ON IBIT (UPDATE ISSUE #200)
The trade is slightly In The Money on the short put side. The trade is taking in losses now but as long as it stays around here, it could easily go back Out of Money by expiry in 2 weeks time. We are in a good position although you are looking at losses at the moment.
Trades are for educational purposes and not a recommendation or financial advise.
IWM STRANGLE (UPDATE ISSUE #201)
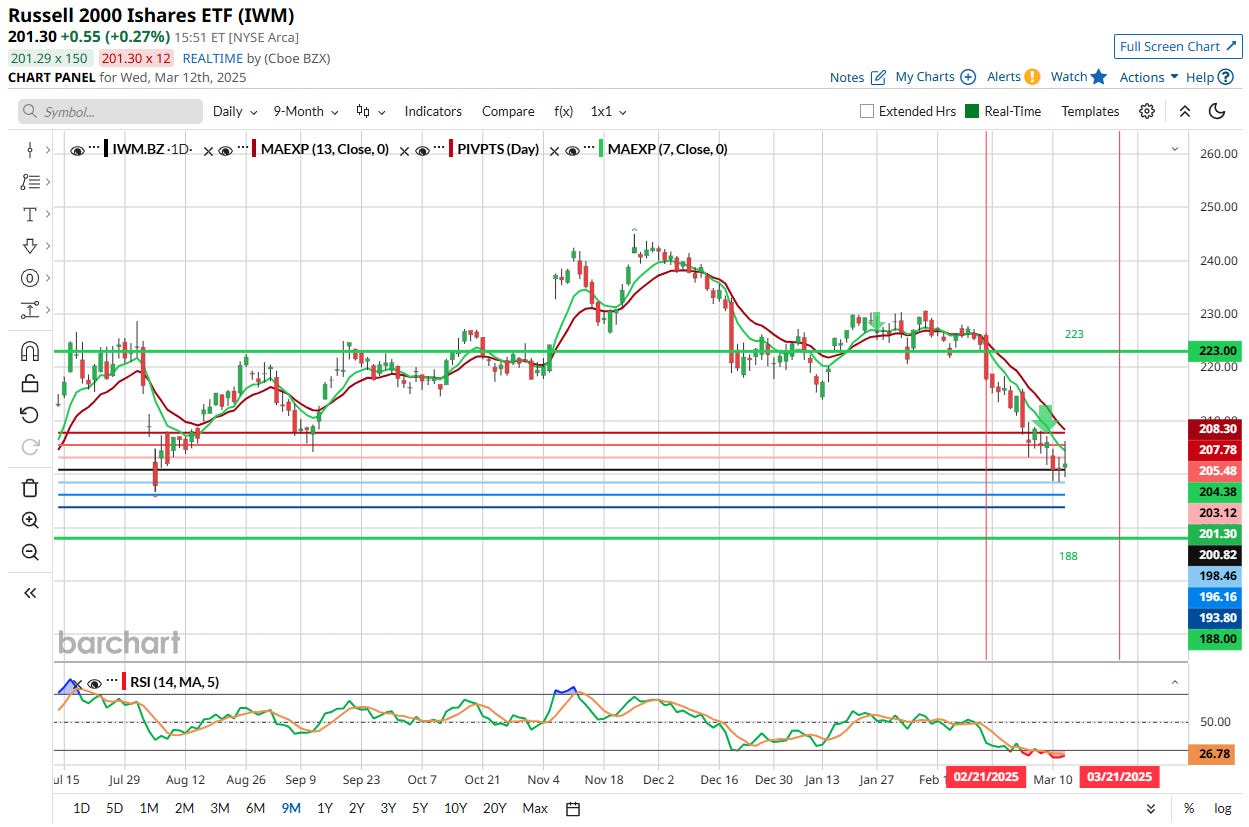
IWM is now trading at $201. Price have dropped $7 from initial entry but well within the range of $188 to $223. Price action is good as it moved to downside continuing the downtrend and could reverse at anytime.
Trades are for educational purposes and not a recommendation or financial advise.
DISCLOSURES
Options involve risk and are not suitable for all investors. Please read Characteristics and Risks of Standardized Options before deciding to invest in options: https://www.theocc.com/components/docs/riskstoc.pdf
MYstyework is an Online Financial Literacy Educator and materials provided is solely by MYstylework and is for informational and educational purposes only. It is not, nor is it intended to be, trading or investment advice or a recommendation that any security, futures contract, transaction or investment strategy is suitable for any person. Trading securities can involve high risk and the loss of any funds invested. MYstylework, through its contents, does not provide investment or financial advice or make investment recommendations. Investment information provided may not be appropriate for all investors, and is provided without respect to individual investor financial sophistication, financial situation, investing time horizon or risk tolerance. MYstylework is not in the business of transacting securities trades or an investment adviser.
we took a 4x of debit paid profit on this.
Exited at 47% profit. 😎 6 days trade